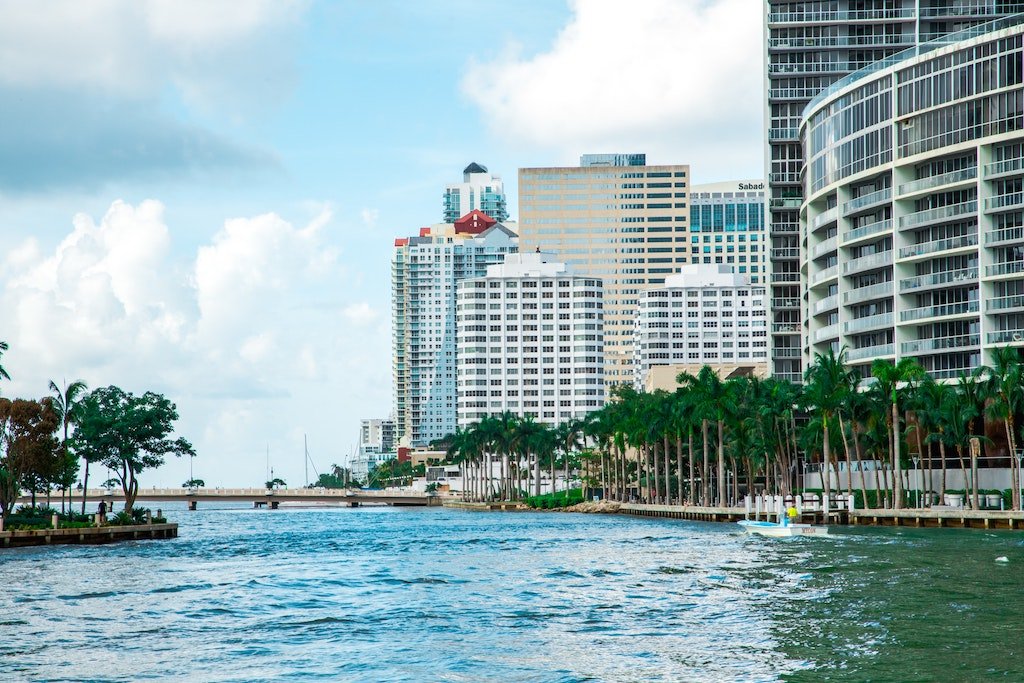
Miami’s incredible, sunny climate and outdoor, social lifestyle create a foundation for the fundamental presence of retail shopping centers and malls in the region. This is just one of the many factors that makes Florida commercial real estate investments so favorable compared to other markets.
More specifically, Miami possesses the 5th Largest shopping center in the country, The Aventura Mall. The Aventura Mall contains 300 stores and 2.7 million square feet of retail floor space. To put this into perspective, it is about half of the size of the world famous Mall of America in Minneapolis, Minnesota; however, it is still massive. Furthermore, it’s a Top-10 Shopping Destination in the USA on a variety of lists, including Travel & Leisure’s latest list.
The thriving shopping centers are ultimately fueled by people spending money and generating circulation. Despite the pandemic, Florida is seeing an increase in population growth due to immigration from other states, as people and companies are looking for more tax-friendly places to live. In order to give some perspective, in 1896 there were only 1,000 residents in Miami MSA, in 1950 there were 622,000 residents, and now there are nearly 6.2 million residents. This perpetual increase of residents is the reason for its nickname, The Magic City.
To further illustrate this bourgeoning retail market, we break down some of the fundamental highlights regarding Miami’s shopping centers, including: average vacancy & rental rates, average sales price, CAP rates, top shopping centers, and retail construction projects.

Miami Shopping Center Vacancy Rates
General retail vacancy rates in Miami were steadily hovering around 3.5% from 2012 to 2018, then began to rise crossing the 4% line toward the end of 2018 heading into 2019. Current vacancy rates for retail real estate is at 4.4% and projected to hit just under 5% by the end of the year. Further projections show vacancy rates leveling back to the 4% range in 2022 / 2023. The pandemic certainly shook up markets around the globe, particularly retail real estate; however, Miami and South Florida in general have kept open and also seen many new residents flocking over from states with higher tax burdens.
These are the figures for general retail in the area, and other retail center types: malls and neighborhood centers are following similar trends and projections for the time being.
Miami Shopping Center Asking Rates
Asking rates in for retail real estate in Miami dipped a bit from the highs of around $38 / square foot in early 2020. As stated by CoStar, “Miami is among the highest-rent retail markets in the nation and has maintained upward rent mobility well above the National Index for much of the past 10 years.” Furthermore, while “losses in the past year have been more than losses across the National Index, the market still outperforms most of the other high-rent markets.”
In spite of the pandemic, demand for retail space in the area is consistent despite the fact that rental asking rates per square foot have been steadily rising from ~$32/ sf in 2015 to ~$37 / sf currently for general retail. Mall space also increased from ~$41 / sf in 2015 to ~$59 / sf presently.
Miami Shopping Center Sales Price Per SF
The same trend is witnessed in terms of sales price per square foot. In 2015, the average sales price was around $315 / sq ft. Now, the average sales price is around $360 / sq ft after hitting a peak of $375 / sq ft in 2019 / 2020. From 2015 to 2021, retail sales / square foot increased 14% in transaction value.
These prices are expected to continue rising after the current dip through 2024 with a projected price of just over $450/ sq ft.
Miami Shopping Center CAP Rates
CAP rates in Miami for malls have dropped from 5.9% in 2015 to 5.6% presently. The lowest CAP rate occurred between 2016 – 2017 at just under 5.6%. Similarly, CAP rates in the overall Miami real estate market have lowered from 5.9% in 2015 to 5.7% in 2021. The highest CAP rate in the overall retail market was back in 2014 /2015 at 5.9%.
These factors contribute to why Miami is nationally a Top-5 performer compared to other metropolitan areas on a yearly basis. It is projected to stay positive in terms of vacancy rates, asking rents, and sales prices for the foreseeable future, forecasted for the coming years through 2024.
Top Miami Shopping Centers by Size

1) The Palms at Town & Country (Miami, FL)
Center Type: Lifestyle Center
Submarket: Kendall
Sq Ft: 638,920
Year Built: 1985
Year Renovated: 2013
# of Stores: 76
# of Parking Spaces: 4,208
% Leased (as of April 2021): 86%
Vacancy Rate (as of April 2021): 14%
2) Las Americas V Central Plaza (Miami, FL)
Center Type: Power Center
Submarket: Kendall
Sq Ft: 606,897
Year Built: 1986
Year Renovated: 2017
# of Stores: 47
# of Parking Spaces: 2,238
% Leased (as of April 2021): 100%
Vacancy Rate (as of April 2021): 0%
3) Main Street Shopping Center (Miami Lakes, FL)
Center Type: Community Center
Submarket: Miami Lakes
Sq Ft: 542,718
Year Built: 1983
Year Renovated: 1989
# of Stores: 50
# of Parking Spaces: 624
% Leased (as of April 2021): 97.5%
Vacancy Rate (as of April 2021): 2.5%
4) Main Street Shopping Center (Miami-Dade County, FL)
Center Type: Community Center
Submarket: Miami Lakes
Sq Ft: 431,774
Year Built: 2019
# of Stores: 6
# of Parking Spaces: 2,100
% Leased (as of April 2021): 94%
Vacancy Rate (as of April 2021): 6%
5) Kendall Town Center (Miami, FL)
Center Type: Power Center
Submarket: Kendall
Sq Ft: 418,920
Completion Date: 2022
# of Stores: Not Listed
# of Parking Spaces: Not Listed
% Leased (as of April 2021): 100%
Vacancy Rate (as of April 2021): 0%
The shopping centers listed above are those that are confined spaces with defined square footage. There are some major retail areas / districts in Miami that are necessary to mention as well, such as: Cocowalk, The Design District, Miracle Mile, and Lincoln Road.
New Retail Construction Projects in Miami
New construction projects in Miami are constantly underway, with 32 currently in progress adding nearly 2M square feet of new space. They are adding to the diverse options that people have for visiting and shopping purposes as residents and tourists in the area.
New Retail Construction Project Statistics
Properties Currently Under Construction: 32 (52 in Q2 2020)
Total Size: 1,879,865 (2,320,740 SF in Q2 2020)
Percent of Inventory: 1.4% (1.7% in Q2 2020)
Preleased: 74.7% (75.5% in Q2 2020)
Top-5 New Retail Construction Projects
1. 9700 Collins Ave
Size: 340,387 SF
Completion Date: Q1 2024
Developer/ Owner: Bal Harbour Shops / Whitman Family Development
Stories: 2
2. Miami Worldcenter – Retail (NE 1st Ave)
Size: 300,000 SF
Completion Date: Q2 2020
Leasing Co: The Forbes Company
Developer/ Owner: Miami Worldcenter Associates, LLC & The Taubman Company
Stories: 3
3. Esplanade at Aventura (19505 Biscayne Blvd)
Size: 215,000 SF
Completion Date: Q2 2020
Developer/ Owner: Seritage Growth Properties
Stories: 3
4. The Plaza Coral Gables (3011 Ponce de Leon Blvd)
Size: 161,000 SF
Completion Date: Q2 2021
Developer/ Owner: Agave Ponce, LLC / Agave Holdings
Stories: 2
5. Doral Square – Building A (8700 NW 36th St)
Size: 141,384 SF
Completion Date: Q2 2020
Developer/ Owner: Agave Ponce, LLC
Stories: 3
View the Top-10 Retail Construction Projects
Data source: CoStar & MMG Equity Parters


[…] Top-5 Miami Shopping Centers: Retail Market Trends & Analysis 2021 […]