
Market Snapshot for Tampa Retail Real Estate
We’ve compiled a range of the latest statistics (vacancy rates, absorption rates, and rental rates) and property transactions for Tampa retail real estate in this report. The Tampa retail report is updated quarterly by our commercial real estate professionals. However, in order to give a broader spectrum of what is going on here, it is important to provide some context for one of the main drivers of investments in retail and commercial real estate in general, population growth.
It is well known that Florida is one of the top states for population growth in the United States. This is due to several key factors: 1) it’s tax-friendly, 2) many people from other states come to Florida to retire, and 3) it’s famous for having wonderful weather year-round, hence its nickname: The Sunshine State. According to World Population Review, Florida is ranked 7th in the country for population growth during 2021 with an increase of +1.1%
Furthermore, according to the US News and World Report, Florida has 11 of the 25 Fastest-Growing Places in the United States with Tampa ranked 15th. Population growth is not the only important factor to consider when looking at the potential of a retail real estate market (or commercial real estate overall); however, it is definitely a solid indicator of where money is going in general.
View our commercial properties in Florida to see what real estate assets are available for lease / sale.
Before we dive into the specific statistics for Tampa’s retail real estate market in Q3 2023, let’s give some perspective with the overall capital markets figures to give some context to the region’s retail sector.
Tampa Retail Capital Markets Statistics Q3 2023
Total Asset Value: $45.8B
12-Month Sales Volume: $1.4B
Average Market Cap Rate: 6.3%
12-Month Market Sale Price Change / SF: +8.5%
Tampa Retail Real Estate Sales Volume by Buyer Type & Origin (Past 12 Months)
Below are the buyer types and their origins, i.e.: local, national, or international investors of retail properties in Tampa.
Buyer Type:
Private: 80%
User: 9%
Institutional: 6%
Private Equity: 2%
REIT / Public: 3%
Buyer Origin:
Local: 20%
National: 72%
Foreign: 8%
Tampa Retail Real Estate Asset Value by Owner Type & Origin (Past 12 Months)
Below are the owner types and the origins of retail property owners in Tampa broken down by their percentage of representation.
Owner Type:
Private: 56%
User: 20%
REIT / Public: 9%
Institutional: 13%
Private Equity: 2%
Owner Origin:
Local: 37%
National: 60%
Foreign: 3%
Tampa Retail Real Estate Statistics: Leases, Sales, and Projects Under Construction – Q2 2023
Here’s a summary of the statistical highlights, latest retail transactions, vacancy / lease trends, and current market activity for Central Florida focusing on Tampa. The analysis below is derived and compiled from leasing stats, latest transactions, and projects under construction in order to further understand the overall state of the retail real estate market in Tampa.
Full List of Top Transactions for Q3 2023 Provided Below
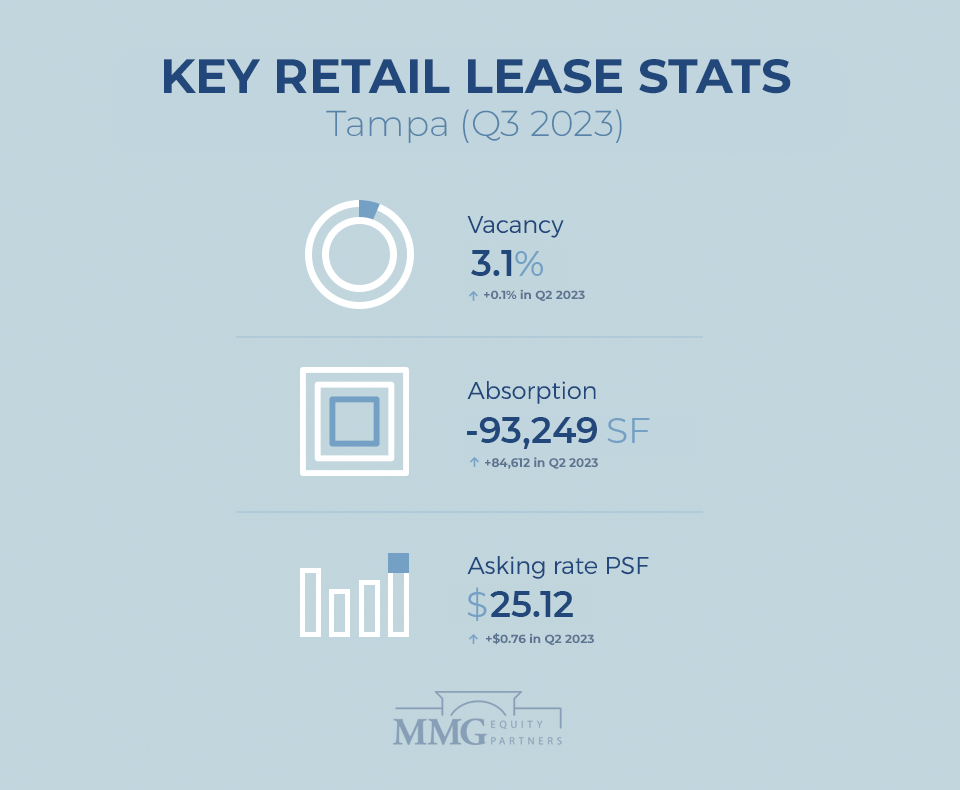
KEY RETAIL LEASE STATS: Tampa (Q3 2023)
- Vacancy: 3.1% (+0.1% compared to 3.0% in Q2 2023)
- Absorption: -93,249 (+84,612 compared to 357,941 in Q2 2023)
- Asking rate PSF: $25.12 (+$0.76 compared to $24.36 in Q2 2023)
TOP RETAIL LEASING STATISTICS: Tampa (Past 12 Months)
12 Month Deliveries in SF: 802K
12 Month Net Absorption in SF: 853K
Vacancy Rate: 3.1%
12 Month Rental Growth: 8.0%
Q2 2023 TOP LEASING TRANSACTIONS: Tampa (Past 12 Months)
1. Top of the Heights – Northwest Tampa
Tenant: Academy Sports + Outdoors
Size: 50,000 SF
Space Type: Shopping Center
Tenant Rep Co: Colliers
Leasing Rep Co: RMC Property Group
2. The Piers Shopping Center – Pasco County
Tenant: American Freight
Size: 44,000 SF
Space Type: Shopping Center
Tenant Rep Co: Transwestern Realty
Leasing Rep Co: Phillips Edison & Company
3. Bloomingdale Square – East Tampa
Tenant: Bealls
Size: 41,425 SF
Space Type: Shopping Center
Tenant Rep Co: Not Listed
Leasing Rep Co: Regency Centers
4. Harbour Island Athletic Club – Downtown Tampa
Tenant: Life Time Athletic
Size: 40,636 SF
Space Type: Shopping Center
Tenant Rep Co: Not Listed
Leasing Rep Co: Not Listed
5. The Walk at Highwoods Preserve – Northeast Tampa
Tenant: Sportsman’s Warehouse
Size: 33,000 SF
Space Type: Shopping Center
Tenant Rep Co: Atlantic Retail
Leasing Rep Co: The Shopping Center
TOP RETAIL SALES STATISTICS: Tampa (Past 12 Months)
Over the course of the past 12 months there have been 729 total retail real estate transactions in Tampa with an average cap rate of 5.9%. The average price per square foot at the time of sale was $265, and the average vacancy was 3.5%.
Sales Comparables: 729
Average Cap Rate: 5.9%
Average Price/ SF: $265
Average Vacancy at Sale: 3.5%
TOP RETAIL SALES TRANSACTIONS: Tampa (Q3 2023)
Top Transaction Highlight in Q3 2023: Westfield Brandon
1. Westfield Brandon (303 – 675 Brandon Town Court)
Price: $220,000,000
Size: 743,398 SF
Price/ SF: $296
Cap Rate: Not Listed
Vacancy: 0%
2. 6665 22nd Ave N
Price: $32,030,982
Size: 100,000
Price/ SF: $293
Cap Rate: Not Listed
Vacancy: 0%
3. Tesla Sales & Service Center (4601 34th St N)
Price: $26,250,000
Size: 100,000 SF
Price/ SF: $263
Cap Rate: Not Listed
Vacancy: 6.0%
4. 2201 Dr Martin Luther King Dr
Price: $20,748,693
Size: 4,892 SF
Price/ SF: $4,241
Cap Rate: 7.8%
Vacancy: 0%
5. 2741 – 2801 E County Line
Price: $17,913,356
Size: 60,191 SF
Price/ SF: $298
Cap Rate: Not Listed
Vacancy: 0%

RETAIL CONSTRUCTION PROJECTS STATISTICS: Tampa (Past 12 Months)
There are currently 57 retail assets / properties under construction in the Tampa market representing nearly 800K square feet of new product. This represents 0.4% of the total retail real estate inventory and over 76.7% of the total space is pre-leased.
Below the stats you’ll find the top-5 largest retail projects currently under development.
Properties Currently Under Construction: 57
Total Size: 785,880
Percent of Inventory: 0.4%
Pre-leased: 76.7%
RETAIL CONSTRUCTION PROJECTS: Tampa (Past 12 Months)
1. The Shops at Big Bend – SW Big Bend Rd
Size: 67,880 SF
Completion Date: Q2 2024
Developer/ Owner: Boos Development Group, Inc / Bayview Properties Ltd LLLP
Stories: 1
2. Publix (32265 Overpass Rd)
Size: 46,000 SF
Completion Date: Q3 2023
Developer/ Owner: Not Listed
Stories: 1
3. N Dale Mabry Hwy
Size: 45,500 SF
Completion Date: Q4 2023
Developer/ Owner: Not Listed / LandQwest Commercial
Stories: 1
4. Proposed Anchor / Grocery – 8224 Little Rd
Size: 45,000 SF
Completion Date: Q1 2024
Developer/ Owner: Not Listed / Pantropic Design
Stories: 1
5. 4616 Avenue Longchamps
Size: 42,000 SF
Completion Date: Q4 2023
Developer/ Owner: Not Listed
Stories: 1
Data sources: MMG Equity Partners & CoStar
Florida Retail Real Estate Reports
We also provide retail real estate reports for other regions of Florida.
Miami Retail Real Estate Report
Orlando Retail Real Estate Report
Leave a Reply